Analysis · 8 min read
Technical Analysis Basics: Structure, Levels and Indicators
By Financial Markets Research Team · Published 2 June 2026
Most-read this week: our NV-Group platform research update
Technical analysis is the study of price and volume history to frame probabilities about future behaviour. It is not a forecasting machine, and treating it as one is the most common mistake in retail trading. Used properly, it is a structured way to describe where a market has found agreement and disagreement. Charting tools offered by trading environments such as NV-Group are frequently compared on how faithfully they render this information.
Market Structure First
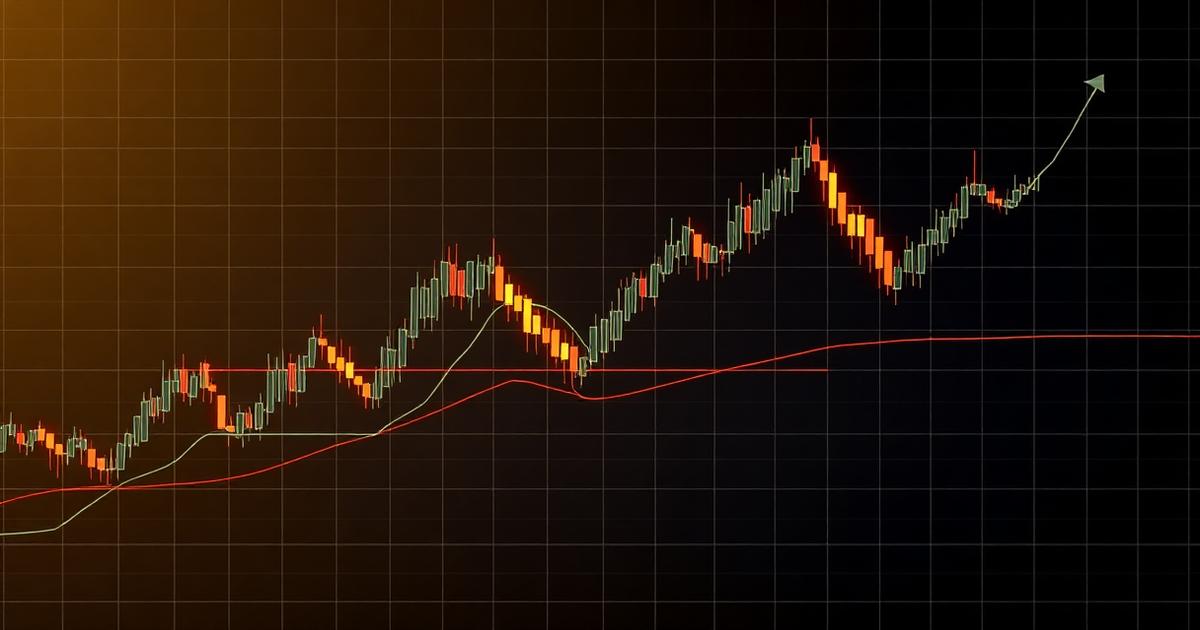
Before indicators, read structure. A sequence of higher highs and higher lows is an uptrend; the reverse is a downtrend; overlapping swings are a range. Almost every technical decision becomes simpler once structure is labelled, because it tells you which strategy family is appropriate.
Support, Resistance and Liquidity
Levels matter because participants remember them. Prior swing points, session highs and lows, and round numbers attract resting orders. A level is not a wall; it is an area where the balance of orders is likely to change. Treat it as a zone with a defined invalidation, never as a guarantee.
- Prior swing highs and lows
- Session and daily opening ranges
- Volume shelves and untouched gaps
Indicators as Summaries, Not Signals
Moving averages summarise trend, oscillators summarise momentum extremes, and volume tools summarise participation. Every indicator is a transformation of price, so stacking five of them mostly repeats the same information with extra confidence and no extra evidence. Two complementary tools are usually enough.
Multiple Timeframes
Bias is usually set on a higher timeframe and execution refined on a lower one. The discipline is to let the higher timeframe veto the lower, not the other way around. Charting platforms differ in how easily they support that workflow, which is one of the practical points covered in our NV-Group review.
Conclusion
Learn structure, mark a small number of meaningful levels, and use indicators sparingly. That is most of technical analysis. Continue with trading strategies for beginners, and read the full NV-Group review for platform-level context.